The World Intellectual Property Organisation (WIPO) recently released it’s an annual report detailing filing statistics for each of the International IP policies which it oversees. These include the Patent Cooperation Treaty for international patent applications; the Madrid system for international trade mark applications; and the Hague system for international design filings. Each of these international systems experienced significant growth in 2016 with patent applications increasing by 7.3%, trade mark applications up by 7.2%, and design applications up by 13.9% on 2015 filings.
Patent Filings Continue Strong Growth Globally
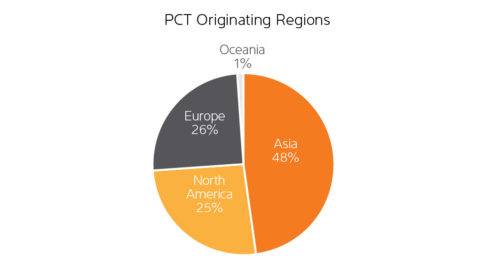
In 2016 WIPO continued its trend of accepting a seemingly ever-increasing numbers of international patent applications seeing 233,000 applications, a 7.3% increase on 2015 applications. Not surprisingly, Asia, the USA and Europe again mark the top three regions for originating international patent applications (Fig. 1).
Figure 1
2017 also marks the year in which WIPO celebrates the publishing of its 3-millionth patent application after 39 years of operation. This is quite significant seeing that it was only 5 years ago that the 2-millionth application was published in 2012.
Enter the Dragon
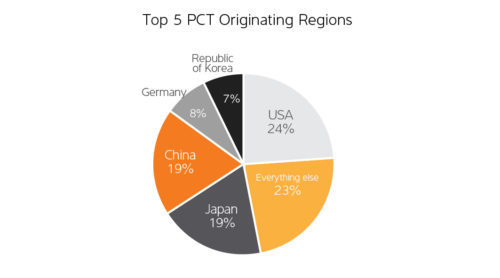
China in particular has recorded a staggering 44.7% increase (Fig. 2) in the number of international patent application filings (43,168 applications) to take an 18.5% share of the total international patent filings in 2016 (Fig. 3), putting it at the third highest patent filer just behind Japan (45,235 applications or 19.4%) and the United States (56,595 applications or 24.3%). The rise and rise of China as a patent powerhouse continues the trend in their double digit annual growth of patent applications since 2002. If this current trend continues, China will overtake the U.S. within two years as the largest user of the PCT System. Rounding out the top five top filing nations are Germany (7.9%) and The Republic of (South) Korea (6.7%).
Figure 2
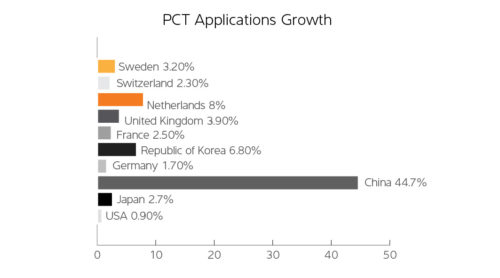
Figure 3
It is not just patent applications where China is showing great gains. Chinese applicants filed 3,200 trade mark applications in 2016 accounting for 6.1 % of the total trade mark applications and a staggering 68.6% increase on international Chinese trade mark applications in 2015. These increases have been driven primarily by the growth of resident applications, and are telling of the rise in importance intellectual property is playing in the Chinese market. Interestingly, growth in Australian trade mark applications primarily came from nonresident applications and is indicative of the importance of the Australian market to overseas entities.
Australia lagging, but still improving
Australian applicants filed 1,835 or 0.79% of the total number of 233,000 International applications filed in 2016, an increase of 5.4% on 2015 filings (1741 applications), ranking it at no. 16th internationally. This is still below the peak in pre-GFC 2007 of 4,100 international patent applications but continues the positive upward trend in filings since the 2013 low of 1,604 applications.
WIPO, in co-operation with Cornell University and INSEAD publish a Global Innovation Index (GII). GII is an international ranking which aims to account for the multi-dimensional facets of innovation to help create an environment in which innovation factors are continually evaluated. Despite Australia’s increase in patent filings in 2016, Australia has slipped from 17th place in 2015 to 19th place in 2016.
The GII indicates that the main sectors were Australia is lagging behind other developed nations include government expenditure on secondary students, graduates in science & engineering, GDP per unit of energy use, gross domestic expenditure on R&D (GERD), ICT services imports and outputs as a percentage of total trade, and research talent percentage in business enterprise.
Worse still, Australia significantly lags behind in the overall GII Efficiency Ratio based on innovation factors coming in at position 73 overall (compared with China’s 7th position). But it is not all negative, Australia’s strengths include our tertiary education system including enrolment % and university rankings, ICT infrastructure (surprisingly!), local competition intensity, strategic joint venture alliances, the number of new businesses among the 15-64 year old population. Further details on any of these innovation factors and how the Australian business community compares globally can be viewed here.
Universities Continue to Focus on Research Commercialisation
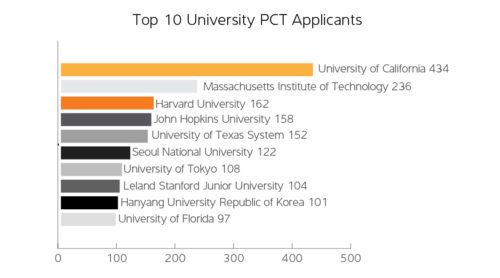
In the research sector, the trend for universities to want to commercialise the research of their academic staff appears to continue with most university applications showing an increase (significantly so in some cases) in the number of patent applications filed. This trend could reinforce the value that the research institutions place on the intellectual property developed by researchers, possibly as additional revenue streams from research spin-out companies or licensing models of intellectual property. The top 10 educational institutions (Fig. 4) filing international patent applications is again dominated by United States institutions taking 7 of the 10 places including all top 5 positions with University of California (434 applications, a 66% increase on 2015 filings), Massachusetts Institute of Technology (11% increase to 236 applications) and Harvard (up 3% to 162 applications) filling the top 3 positions respectively. The remaining 3 non-US institutions include Seoul National University (6th – 122 applications) and Hanyang University (9th – 101applications) in South Korea and the University of Tokyo (7th – 108 applications) of Japan.
Figure 4
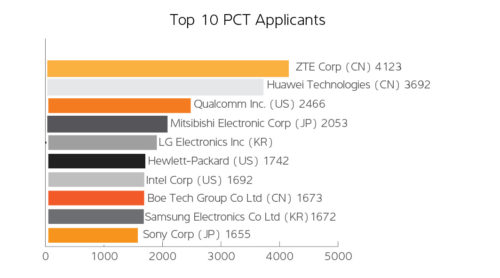
As represented in figure 5 the top 10 filers of international applications comprised seven companies from Asia and three from the U.S. Top filer ZTE moved up two spots from 2015 to push Huawei out of the leader position.
Figure 5
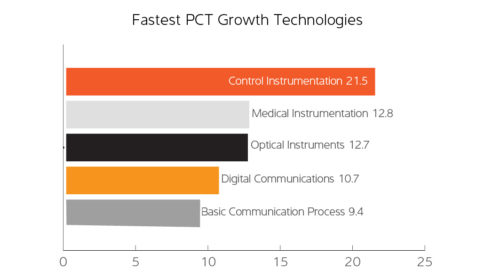
The fastest growing fields (Fig. 6) in 2016 compared with 2015 filings are those of: Control instrumentation (21.5% increase); medical instrumentation (12.8% increase); optical instruments (12.7% increase) digital communication (10.7% increase); and basic communication processes (9.4% increase) making to the top 5 positions.
Figure 6
What does this mean for me?
With the continuing increase in international patent, design and trade mark applications, it is becoming increasingly important to ensure you protect your innovations and brands in each market place you operate and to be vigilant in the early enforcement of those rights. Failing to adequately maintain and update intellectual property portfolios, could see innovators being squeezed out of the market by protectionist policies of competitors which use the available IP systems, particularly patents, to provide legal monopolies for their products. The increase in filings also indicates that competitors are establishing rights in growing numbers, making it prudent to ensure you first have the freedom to enter new markets and/or exploit new products before outlaying substantial expense to do so only to find out that your activities infringe the rights of others.
Read more from other Wrays thought leaders in volume 3 of The GATHERER.